| ________________
CM . . .
. Volume XXIII Number 30. . . .April 14, 2017

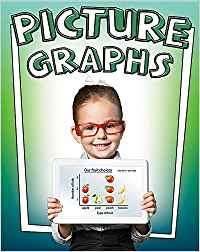 |
Picture Graphs. (Get Graphing! Building Data Literacy Skills).
Crystal Sikkens.
St. Catharines, ON: Crabtree, 2017.
24 pp., pbk., hc., & html, $9.95 (pbk.), $18.36 (RLB).
ISBN 978-0-7787-2636-4 (pbk.), ISBN 978-0-7787-2632-6 (RLB), ISBN 978-1-4271 1839-4 (html).
Subject Headings:
Graphic methods-Juvenile literature.
Charts, diagrams, etc. -Juvenile literature.
Mathematics-Charts, diagrams, etc. -Juvenile literature.
Grades 1-3 / Ages 6-8.
Review by Willow Moonbeam.
*** /4
|
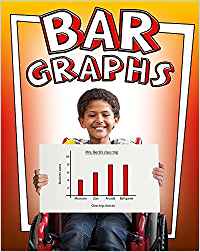 |
Bar Graphs. (Get Graphing! Building Data Literacy Skills).
Crystal Sikkens.
St. Catharines, ON: Crabtree, 2017.
24 pp., pbk., hc., & html, $9.95 (pbk.), $18.36 (RLB).
ISBN 978-0-7787-2634-0 (pbk.), ISBN 978-0-7787-2624-1 (RLB), ISBN 978-1-4271-1837-0 (html).
Subject Headings:
Graphic methods-Juvenile literature.
Charts, diagrams, etc. -Juvenile literature.
Mathematics-Charts, diagrams, etc. -Juvenile literature.
Grades 1-3 / Ages 6-8.
Review by Willow Moonbeam.
*** /4
|
 |
Line Graphs. (Get Graphing! Building Data Literacy Skills).
Lizann Flatt.
St. Catharines, ON: Crabtree, 2017.
24 pp., pbk., hc., & html, $9.95 (pbk.), $18.36 (RLB).
ISBN 978-0-7787-2635-7 (pbk.), ISBN 978-0-7787-2625-8 (RLB), ISBN 978-1-4271-1838-7 (html).
Subject Headings:
Graphic methods-Juvenile literature.
Charts, diagrams, etc. -Juvenile literature.
Mathematics-Charts, diagrams, etc. -Juvenile literature.
Grades 1-3 / Ages 6-8.
Review by Willow Moonbeam.
*** /4
|
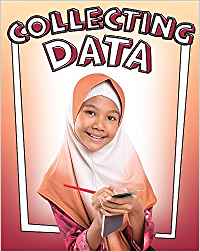 |
Collecting Data. (Get Graphing! Building Data Literacy Skills).
Lizann Flatt.
St. Catharines, ON: Crabtree, 2017.
24 pp., pbk., hc., & html, $9.95 (pbk.), $18.36 (RLB).
ISBN 978-0-7787-2637-1 (pbk.), ISBN 978-0-7787-2633-3 (RLB), ISBN 978-1-4271-1840-0 (html).
Subject Headings:
Science-Methodology-Juvenile literature.
Mathematical statistics Juvenile literature.
Observation (Scientific method) Juvenile literature.
Quantitative research-Juvenile literature.
Grades 1-3 / Ages 6-8.
Review by Willow Moonbeam.
*** /4
|
| |
|
excerpt:
A graph shows information so that other people can understand it quickly and easily. There are many different kinds of graphs. Bar graphs, picture graphs, and line graphs are some of the most common kinds of graphs. Each type of graph shows a different type of information. (From Line Graphs.)
Data collection begins with a question you want answered. Some questions can be answered simply with a yes or a no. Other questions have several possible answers. The question you ask needs to be created carefully so that it will give you the answer or the information you need. Before creating your question, think about what you want to find out, and what kind of data you need to gather in order to answer your question. (From Collecting Data.)
If this is the year that your child is going to be learning about graphs for the first time, “Get Graphing! Building Data Literacy Skills” is the series for you. These four books give an introduction to creating and using three main types of graphs for realistic situations. The books necessarily cover some of the same information as the topics are closely related, and all are laid out in the same way, making it easier to use them together. The data used in the graphs are everyday things that readers will be able to understand, things like the kinds of games a class might like to play, how a plant grows over time or food and exercise choices.
There is quite a bit of information on every page, information that is divided between a text section and either illustrations or text bubbles. The graphs are represented clearly with each part labelled and explained in one or both of the types of text. All of the pictures of data and graphs are clear enough to be read and interpreted to add to understanding the topic.
Each book has a table of contents, glossary and index. Another page lists a number of books and websites where more information can be found. There are also questions scattered throughout each book with the caption “Be a Data Detective!”, and all the answers are found at the back. There are many pictures on every page, some of the graphs, some cartoons, mostly of happy children participating in learning activities, and many of people in various activities including teaching and making the graphs. The subjects include a wide variety of children and some adults, an encouraging mix where most readers will find themselves represented.
Picture Graphs
These are the simplest and most appealing type of graph and are presented as such. The graphs are made of favourite items, flowers and animals using very different symbols all of which are charming, including happy faces, musical notes, the food itself or hand drawn flowers. Some of the images are shown on graph paper and others on blank paper showing different methods and effects. Most importantly the steps for creating the chart are given clearly over several pages. One of the methods shown is a tally count, a useful skill.
Bar Graphs
Bar graphs are very similar to picture graphs, a comparison that is made in both books, with many of the same requirements. This book uses a different set of examples to illustrate the method. A particular student is used throughout as the actor creating the graph, and all the parts are well-defined and correctly used in each graph presented. This is, of course, very important in order to avoid confusion when learning a new topic.
Line Graphs
The fact that line graphs are better used for different types of data than bar graphs is shown well in this book. Again the parts of the graph are well-presented and defined throughout with good illustrations. The questions in the “Be a Data Detective!” sections are very good, many including a choice to see if the student can really understand the meaning of what is being represented. The focus on collecting health related data is also welcome.
Collecting Data
Although each of the other books in this series discusses some aspects of collecting data, this book makes the concepts more obvious and clear. Part of the point here is to help students come up with their own choice of a topic so that they can practice the methods of collecting the data. Broad categories are suggested: observing, measuring, experimenting and polling their classmates. Later in the book, Venn diagrams and line plots are presented briefly.
These books in the “Get Graphing! Building Data Literacy Skills” series are wonderfully clear and easy to follow. Each type of graph is presented and defined well, and examples are used to make it clear that they are useful in ordinary situations. It would be better if they had included pie graphs in the types they had presented although this is not a large difficulty here. This series would make a practical addition to a classroom or school library.
Recommended.
Willow Moonbeam, a librarian and former community college math professor, lives in Toronto, ON, with two cats that are completely indifferent to math.
To comment
on this title or this review, send mail to cm@umanitoba.ca.
Copyright © the Manitoba Library Association. Reproduction for personal
use is permitted only if this copyright notice is maintained. Any
other reproduction is prohibited without permission.
Next Review | Table of Contents For This Issue - April 14, 2017
CM Home | Back Issues
| Search
| CM Archive
| Profiles Archive
|